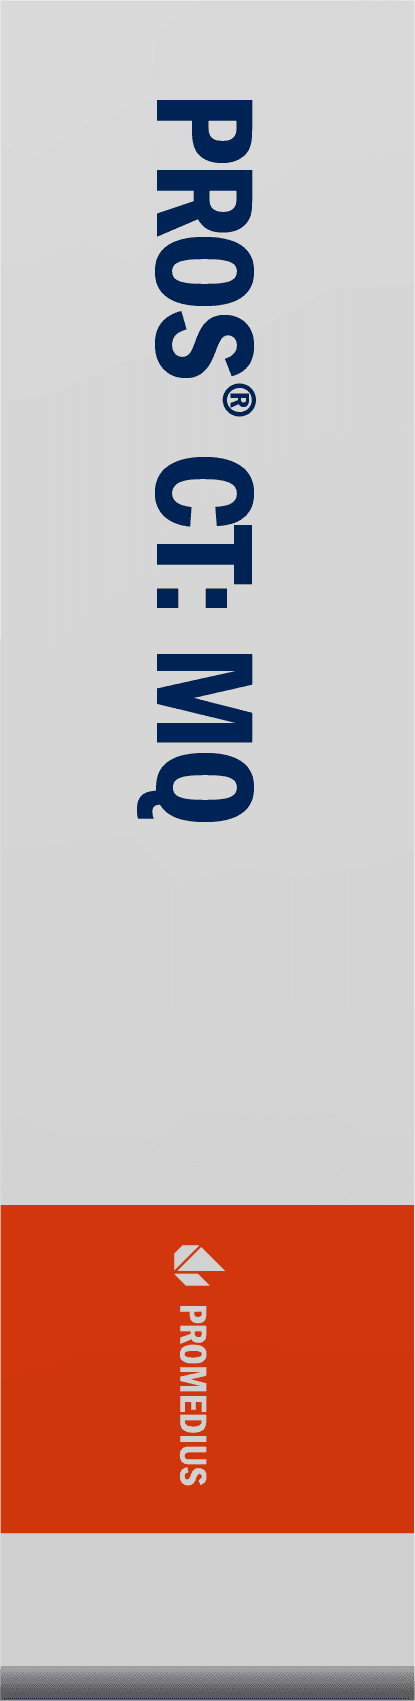
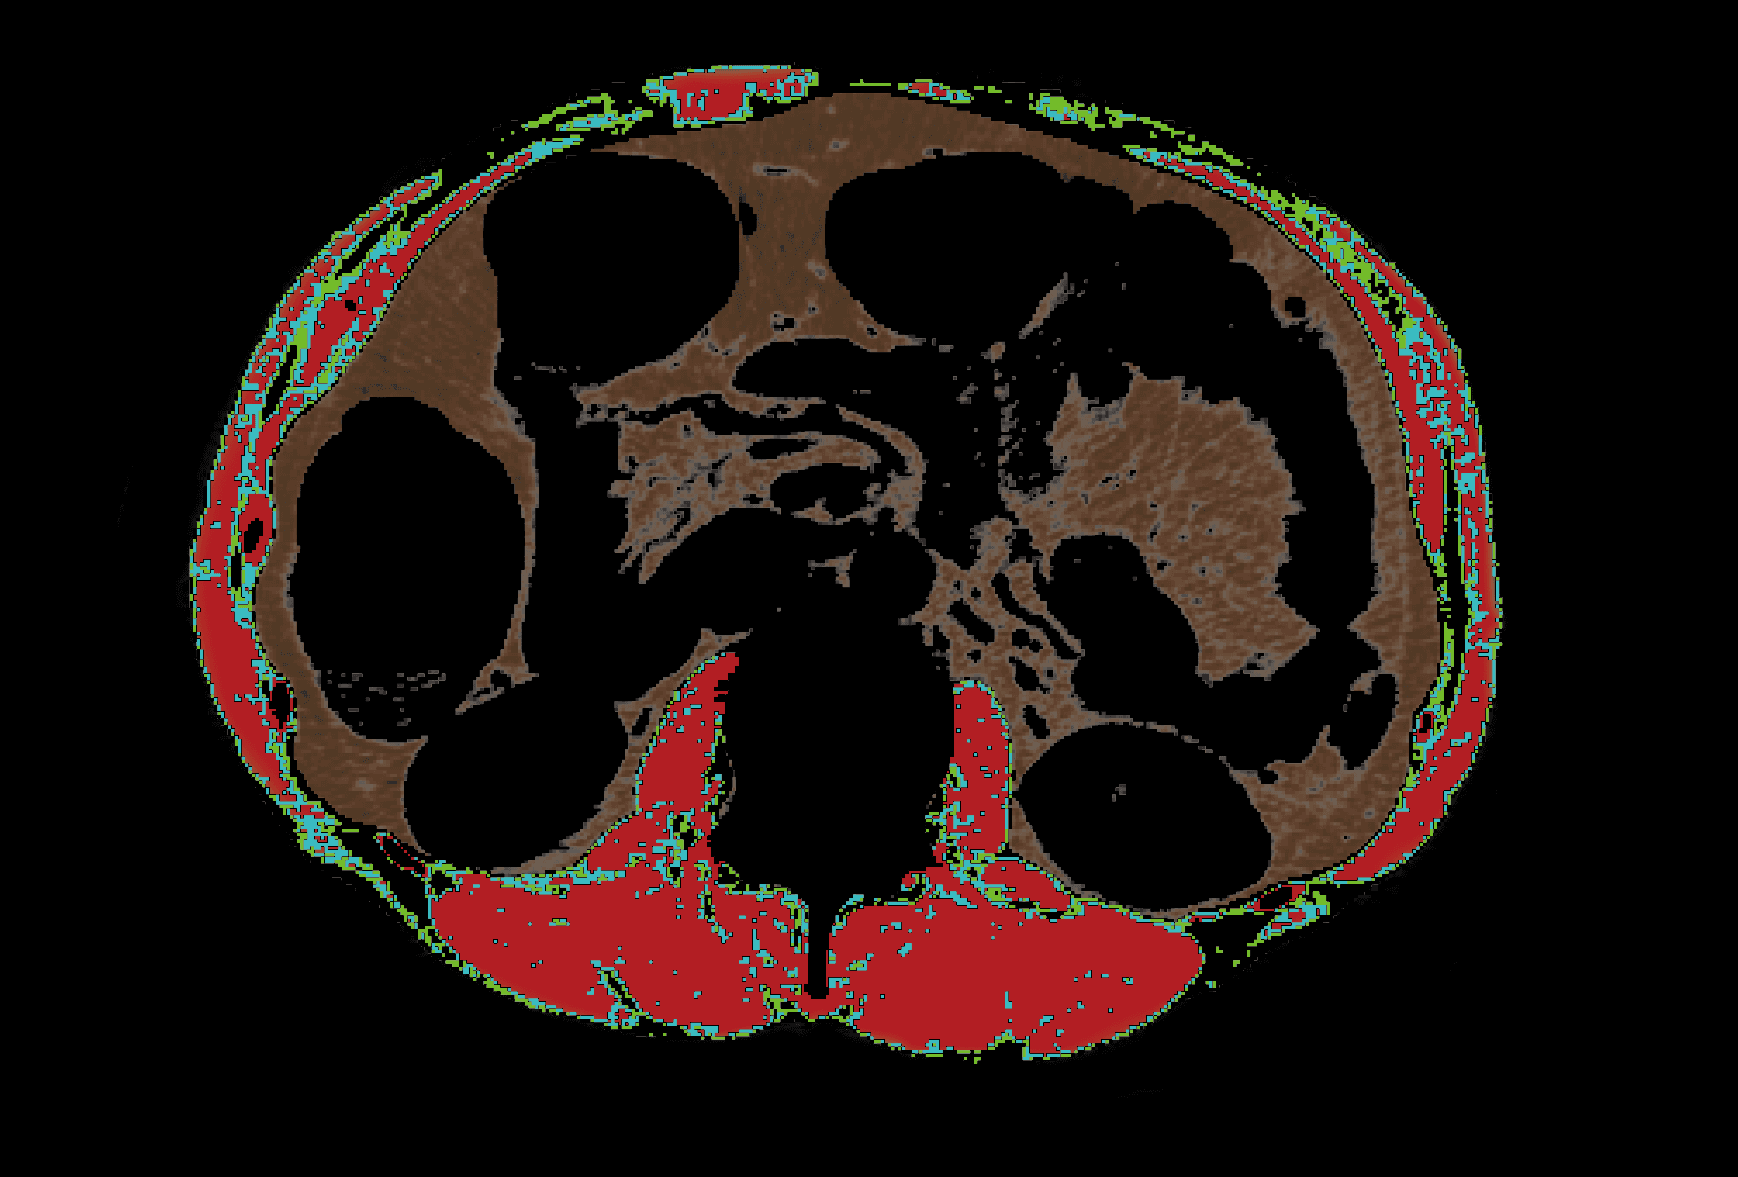
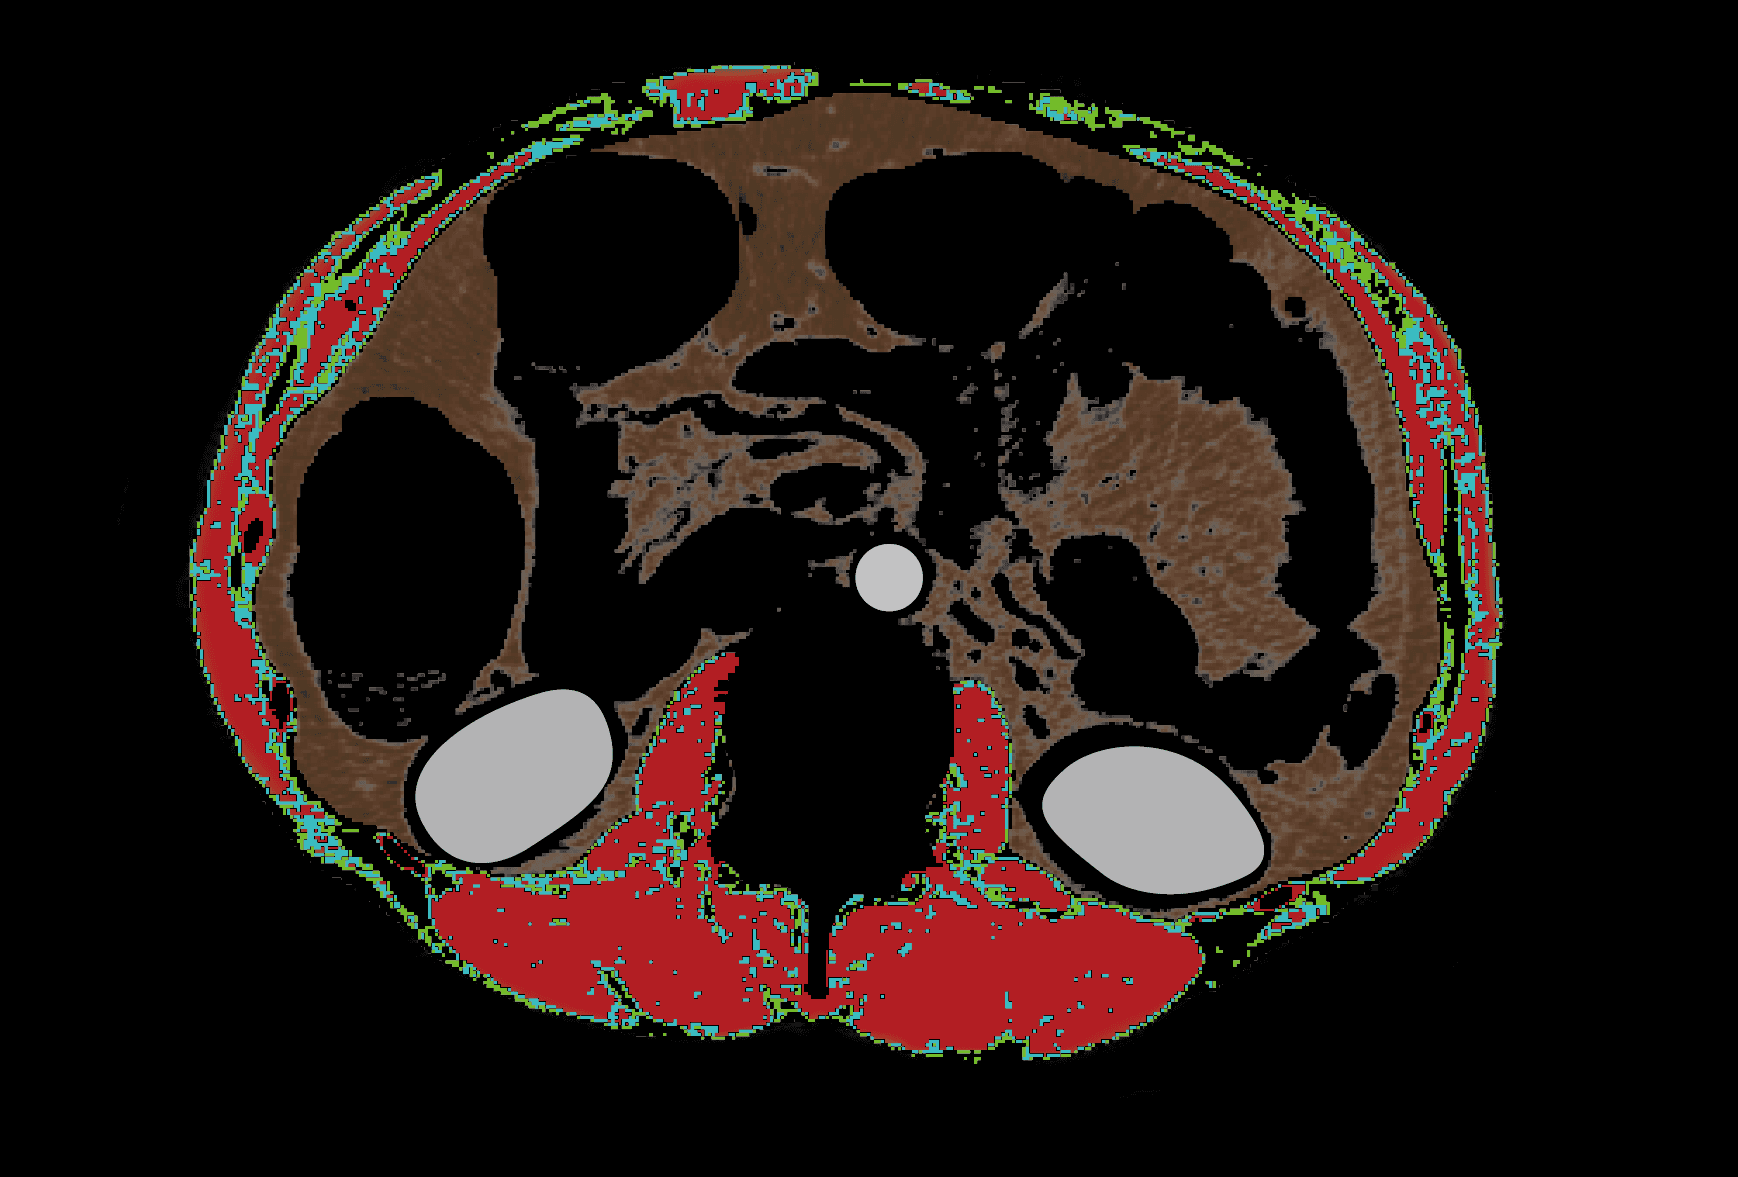
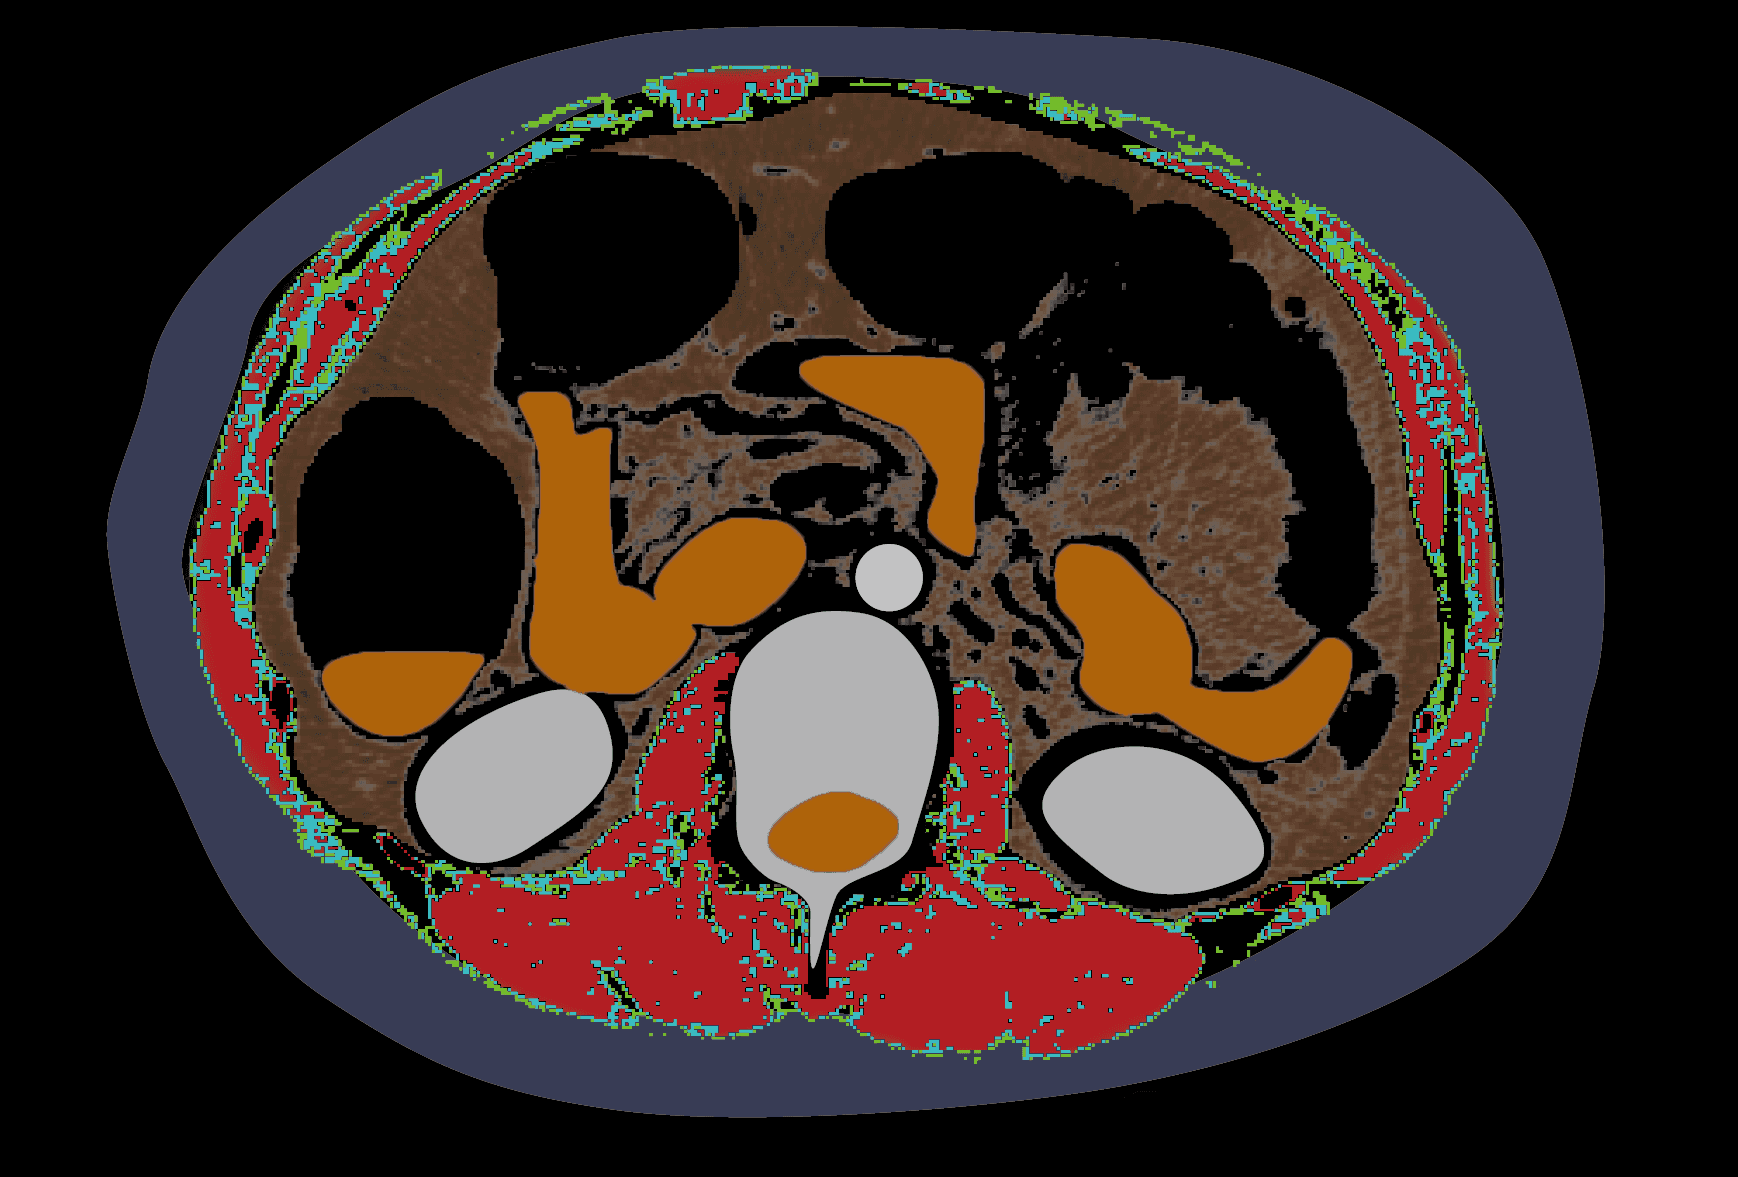
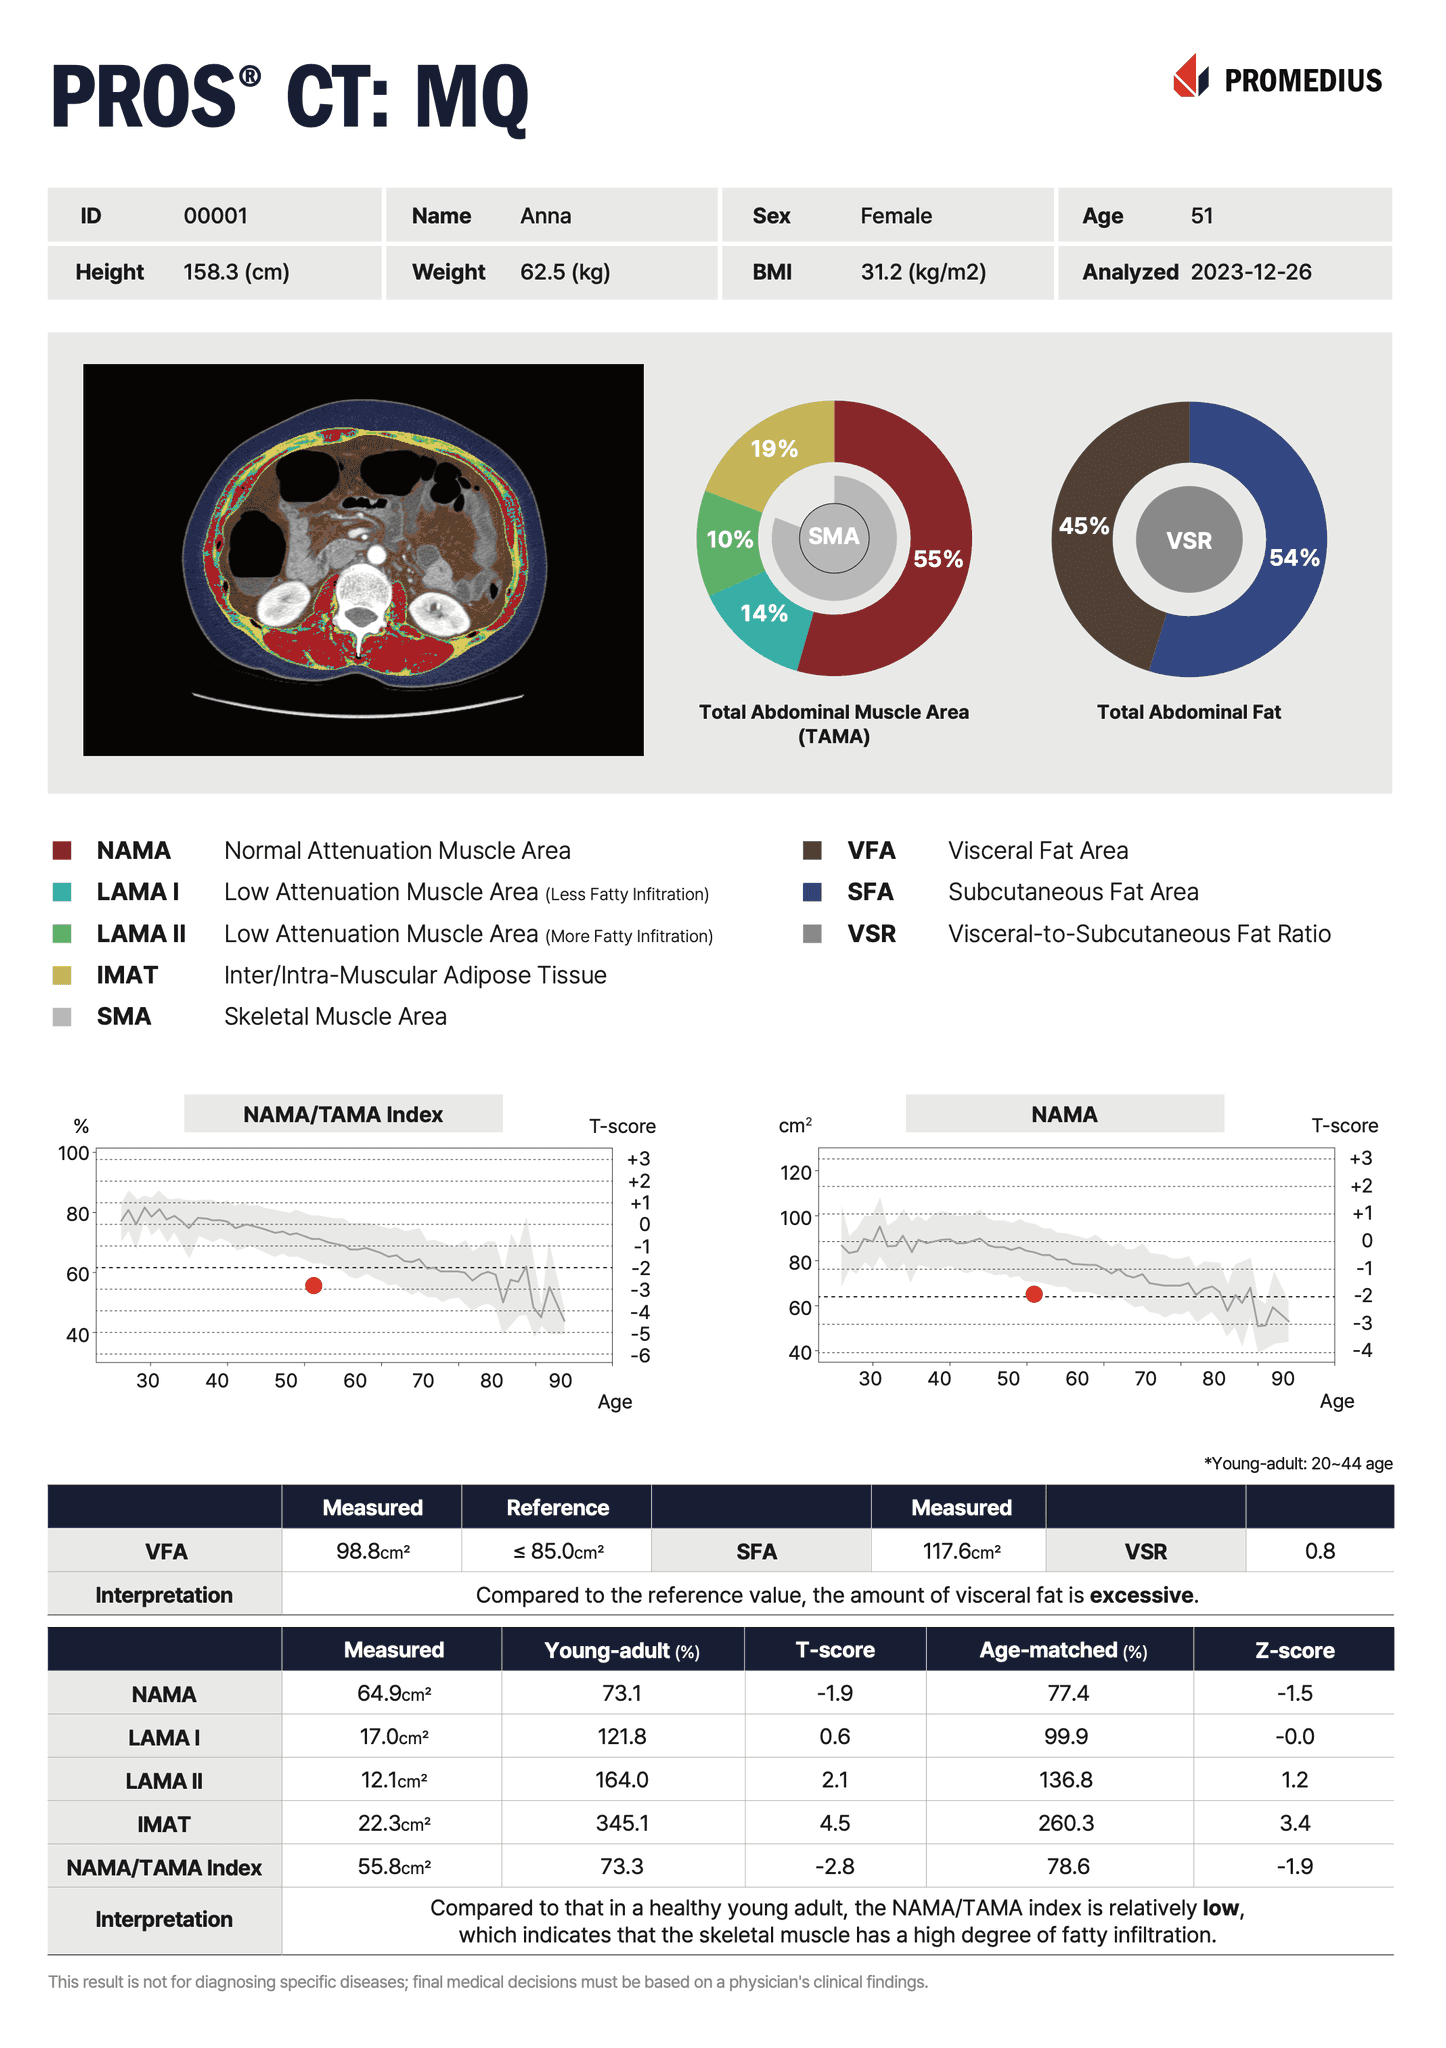
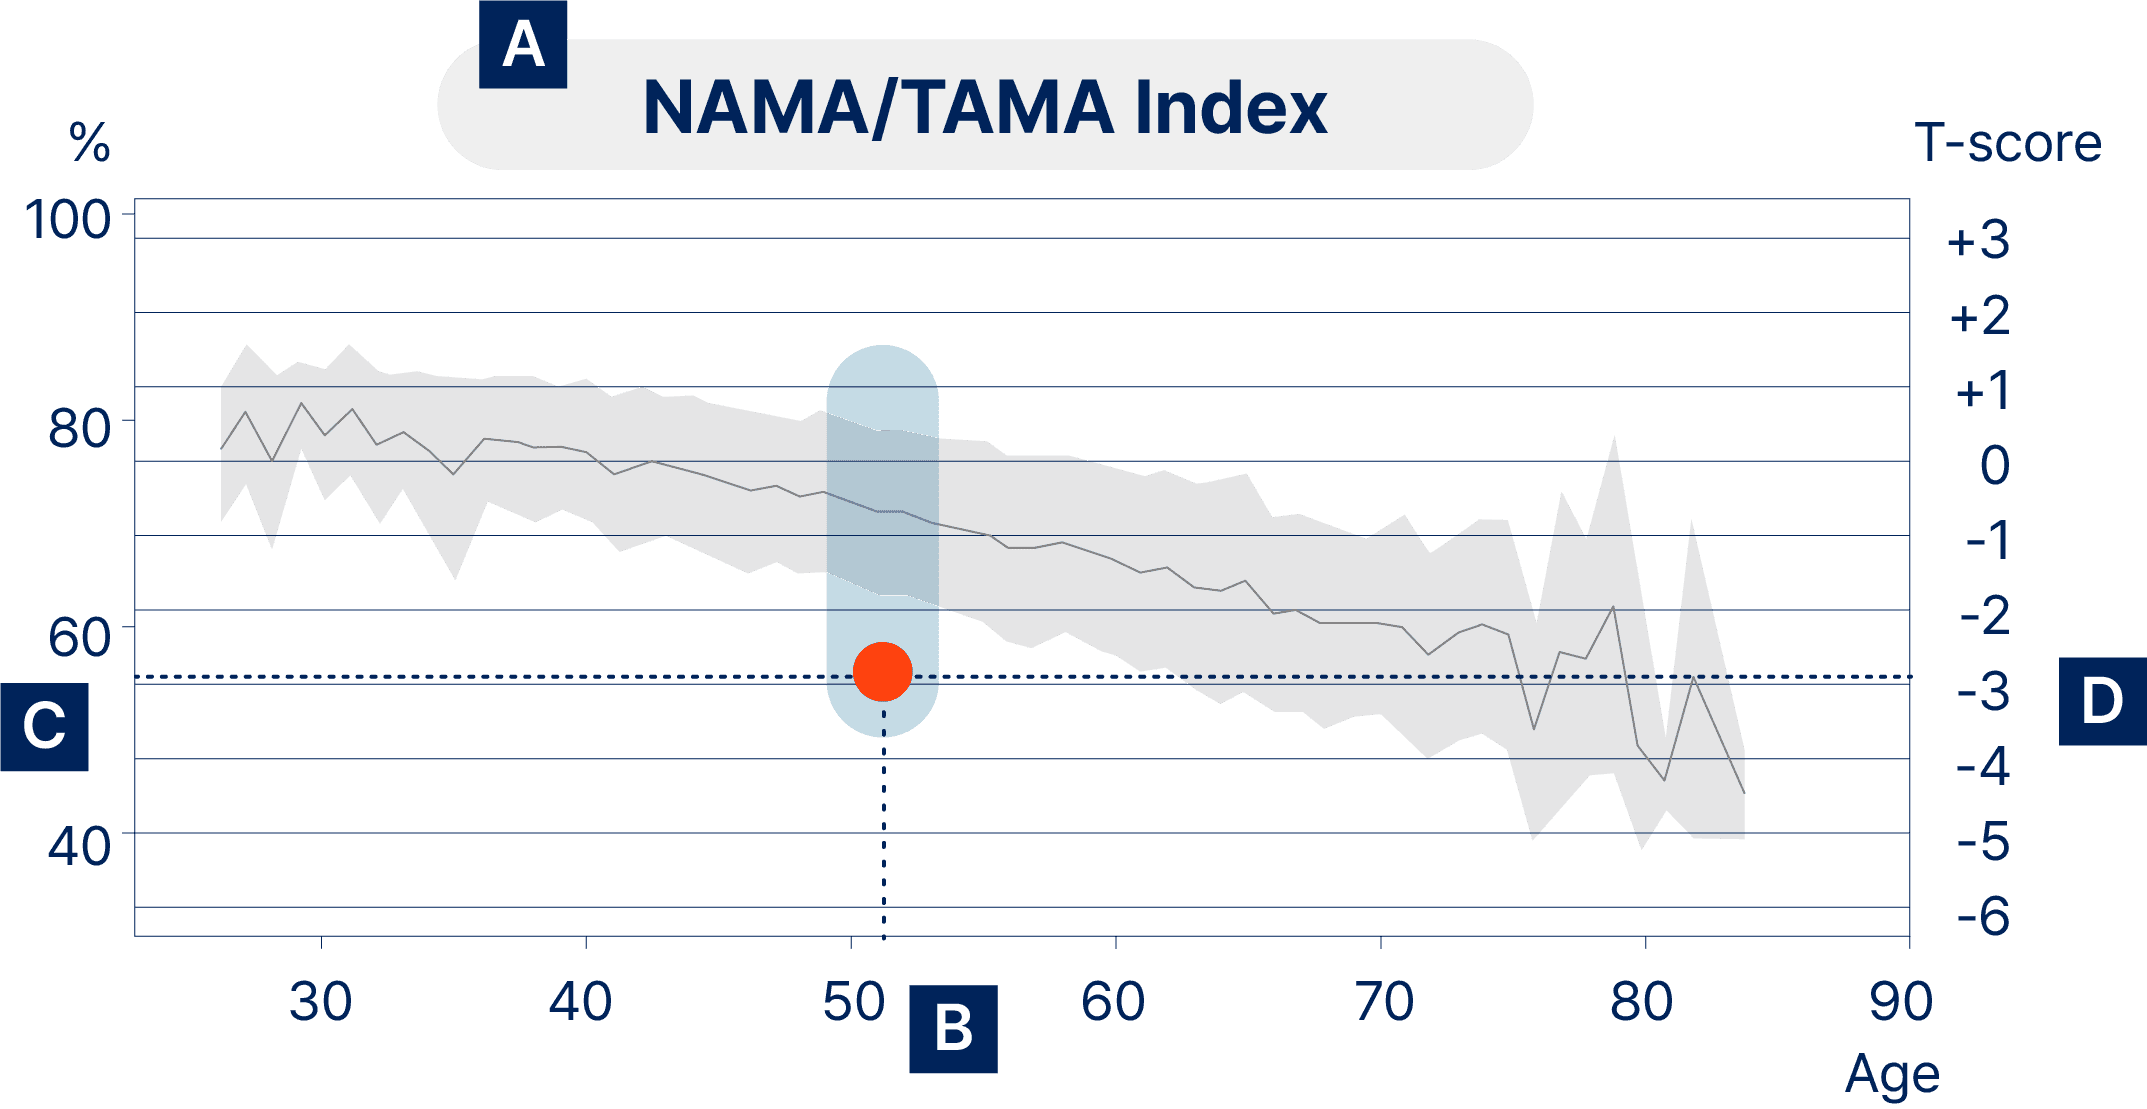
PROS® CT: MQ

Abdominal CT-based

muscle/fat segmentation AI solution

PROS® CT: MQ segments and quantifies fat and muscle quality by leveraging abdominal CT images.

L3 Slice
L3 Slice

Automatic extraction of L3 Slice

The deep learning algorithm automatically identifies and extracts the L3 slice, the key cross-sectional image that best represents muscle and fat distribution on CT.

Segmentation and measurement of muscle/fat area

AI precisely segments muscle and fat based on quality and provides quantified data.

Intuitive and accessible analysis is provided through various structured reports and patient-focused explanatory materials.

REPORT

REPORT

REPORT

REPORT

REPORT

Rich information in diverse reports

Rich information in diverse reports

English and Korea report provided

English and Korea report provided

Commentary guide for the examinee with detailed explanation (optional)

Commentary guide for the examinee with detailed explanation (optional)

PROS® CT: MQ exclusive catalog (optional)

PROS® CT: MQ exclusive catalog (optional)

Key indicators associated with metabolic diseases are provided

Key indicators associated with metabolic diseases are provided

Visceral Fat Area

VFA

A fat index strongly correlated with metabolic state

Visceral Fat Area

VFA

A fat index strongly correlated with metabolic state

Proportion of healthy muscle

NAMA1/TAMA2 Index

A new index that represents the proportion of non-fat-infiltrated muscle relative to the total abdominal muscle, offering more detailed insights into muscle quality

Proportion of healthy muscle

NAMA1/TAMA2 Index

A new index that represents the proportion of non-fat-infiltrated muscle relative to the total abdominal muscle, offering more detailed insights into muscle quality

Low Attenuation Muscle Area

LAMA3 I, II

Classify muscle quality into Type I, II based on the extent of fat infiltration and deliver more detailed information *Hounsfield Unit(HU)

Low Attenuation Muscle Area

LAMA3 I, II

Classify muscle quality into Type I, II based on the extent of fat infiltration and deliver more detailed information *Hounsfield Unit(HU)

1.Normal Attenuation Muscle Area

2.Total Abdominal Muscle Area

3.Low Attenuation Muscle Area

1.Normal Attenuation Muscle Area

2.Total Abdominal Muscle Area

3.Low Attenuation Muscle Area

Personalized measurements are provided in comparison to the averages and distributions of healthy adults and age-matched populations.

Personalized measurements are provided in comparison to the averages and distributions of healthy adults and age-matched populations.

A

Index Title: Type of the index represented by the graph.

B

Age: The patient*s age.

C

Index results: view the analysis results on the left y-axis.

D

T-Score: check the relative position of the patient in comparison to average healthy adults on the right y-axis.

E

Z-Score: check the relative difference in comparison to age-matched adults. 

Insurance and Prevention Providers

English and Korea report provided

Commentary guide for the examinee with detailed explanation (optional)

PROS® CT: MQ exclusive catalog (optional)

Trained on high-quality, validated data,

our AI model demonstrated reliable performance.

0

%

0

%

96% Muscle/fat
segmentation alignment

Model performance was validated using 21,708 abdominal CT scans, showing a high level of concordance.

Explore the association between metabolic diseases and
PROS® CT: MQ index.

Type 2 diabetes mellitus

Higher VFA and VSR at baseline were independent risk factors for the development of T2DM.

NAFLD
(Non-alcoholic fatty liver disease)

A higher proportion of good quality muscle was associated with lower risks of NAFLD and fibrosis.

Sarcopenia

BMI-adjusted index(SMA/BMI) was the best index of CT-measured SMA to reflects the age-related muscle changes and to maximize the diagnostic yield for sarcopenia.

Myosteatosis

The NAMA/TAMA index developed in this study was useful for assessing myosteatosis

Have questions?

Check out our FAQ for more information.

What is PROS CT: MQ?

What is PROS CT: MQ?

What is NAMA, TAMA, IMAT?

What is NAMA, TAMA, IMAT?

Can a single L3 slice accurately represent overall muscle and fat distribution?

Can a single L3 slice accurately represent overall muscle and fat distribution?

How is PROS CT: MQ different from conventional body composition analyzers?

How is PROS CT: MQ different from conventional body composition analyzers?

What does the NAMA/TAMA Index graph represent?

What does the NAMA/TAMA Index graph represent?

Experience PROS® CT: MQ and

request your demo today.

Experience PROS® CT: MQ andrequest your demo today.

프로메디우스 주식회사.

Copyright 2025 PROMEDIUS INC. All rights reserved.

05510 서울특별시 송파구 올림픽로35다길 13, 국민연금 잠실사옥 4층(신천동)

프로메디우스 주식회사.

Copyright 2025 PROMEDIUS INC. All rights reserved.

05510 서울특별시 송파구 올림픽로35다길 13, 국민연금 잠실사옥 4층(신천동)