

L3 Slice
Automatic extraction of L3 slice
The deep learning algorithm automatically identifies and extracts the L3 slice, the key cross-sectional image that best represents muscle and fat distribution on CT.
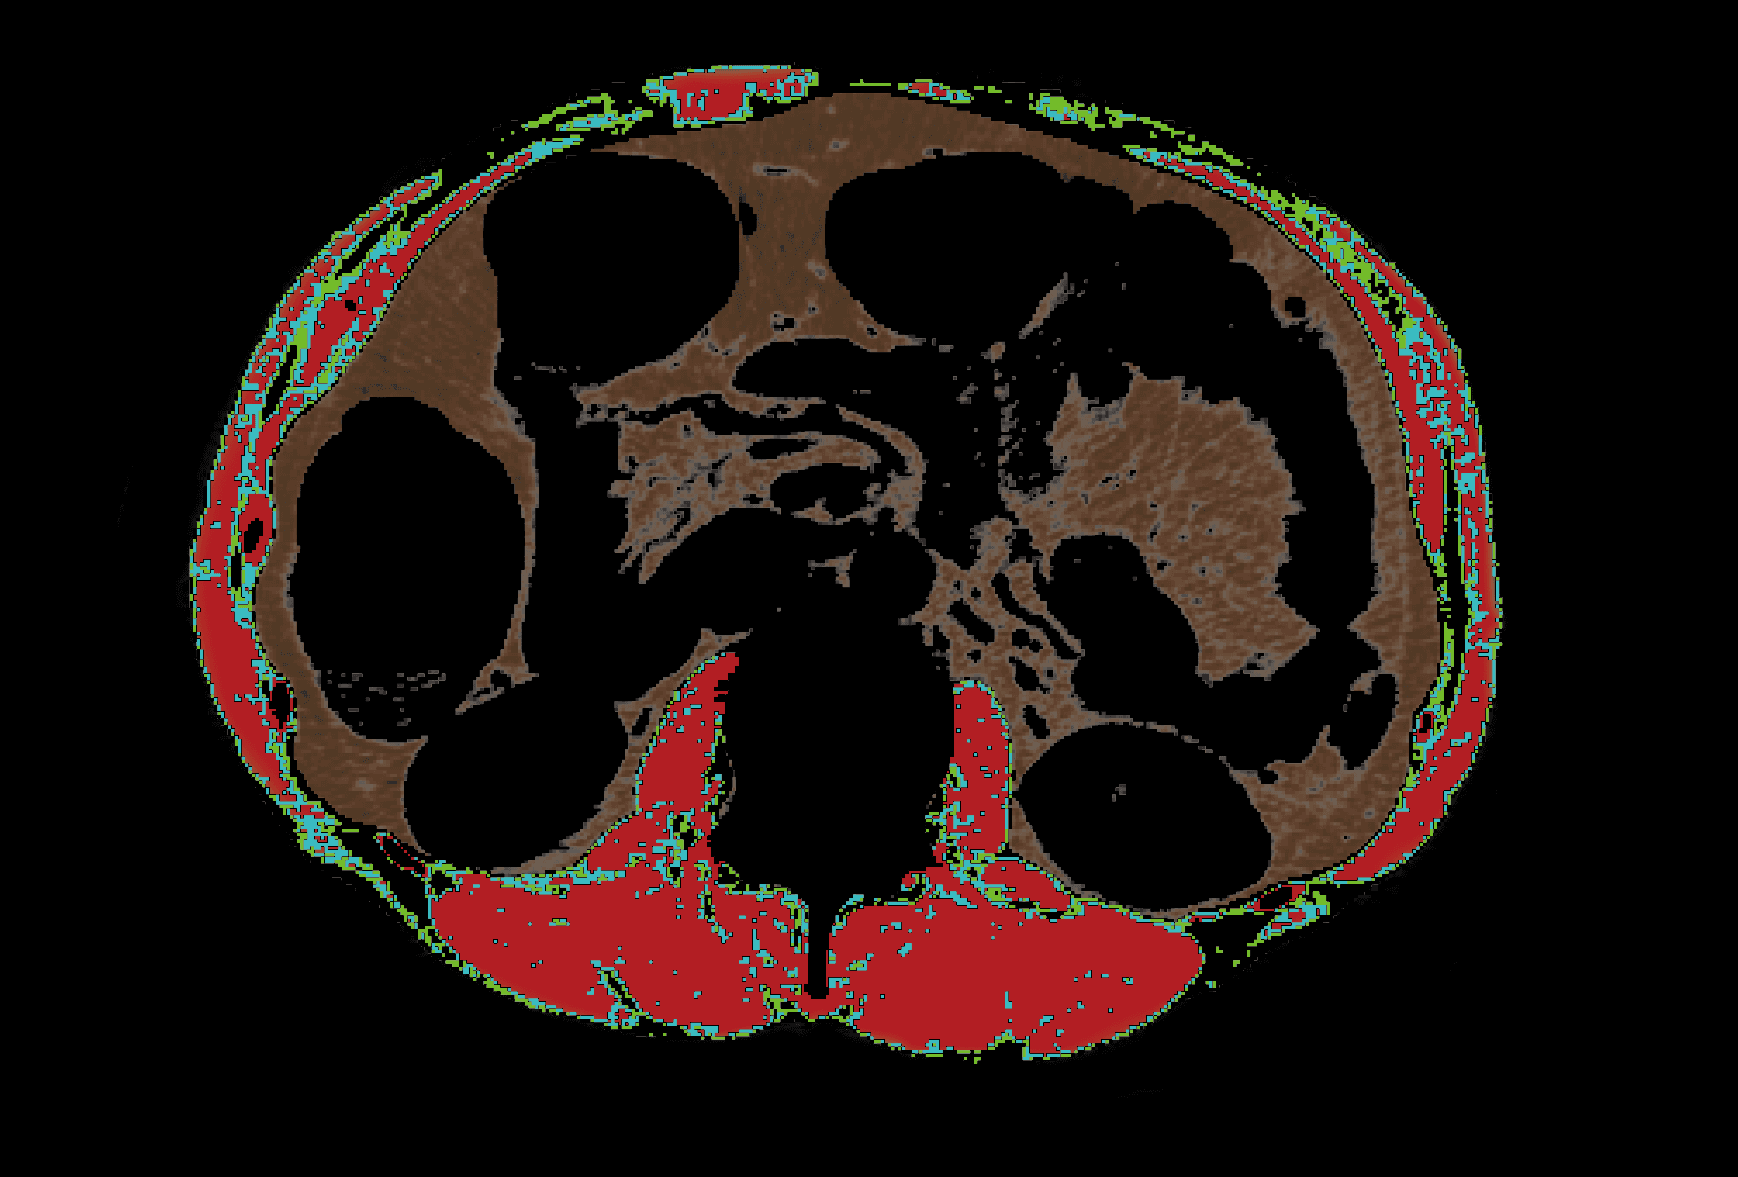
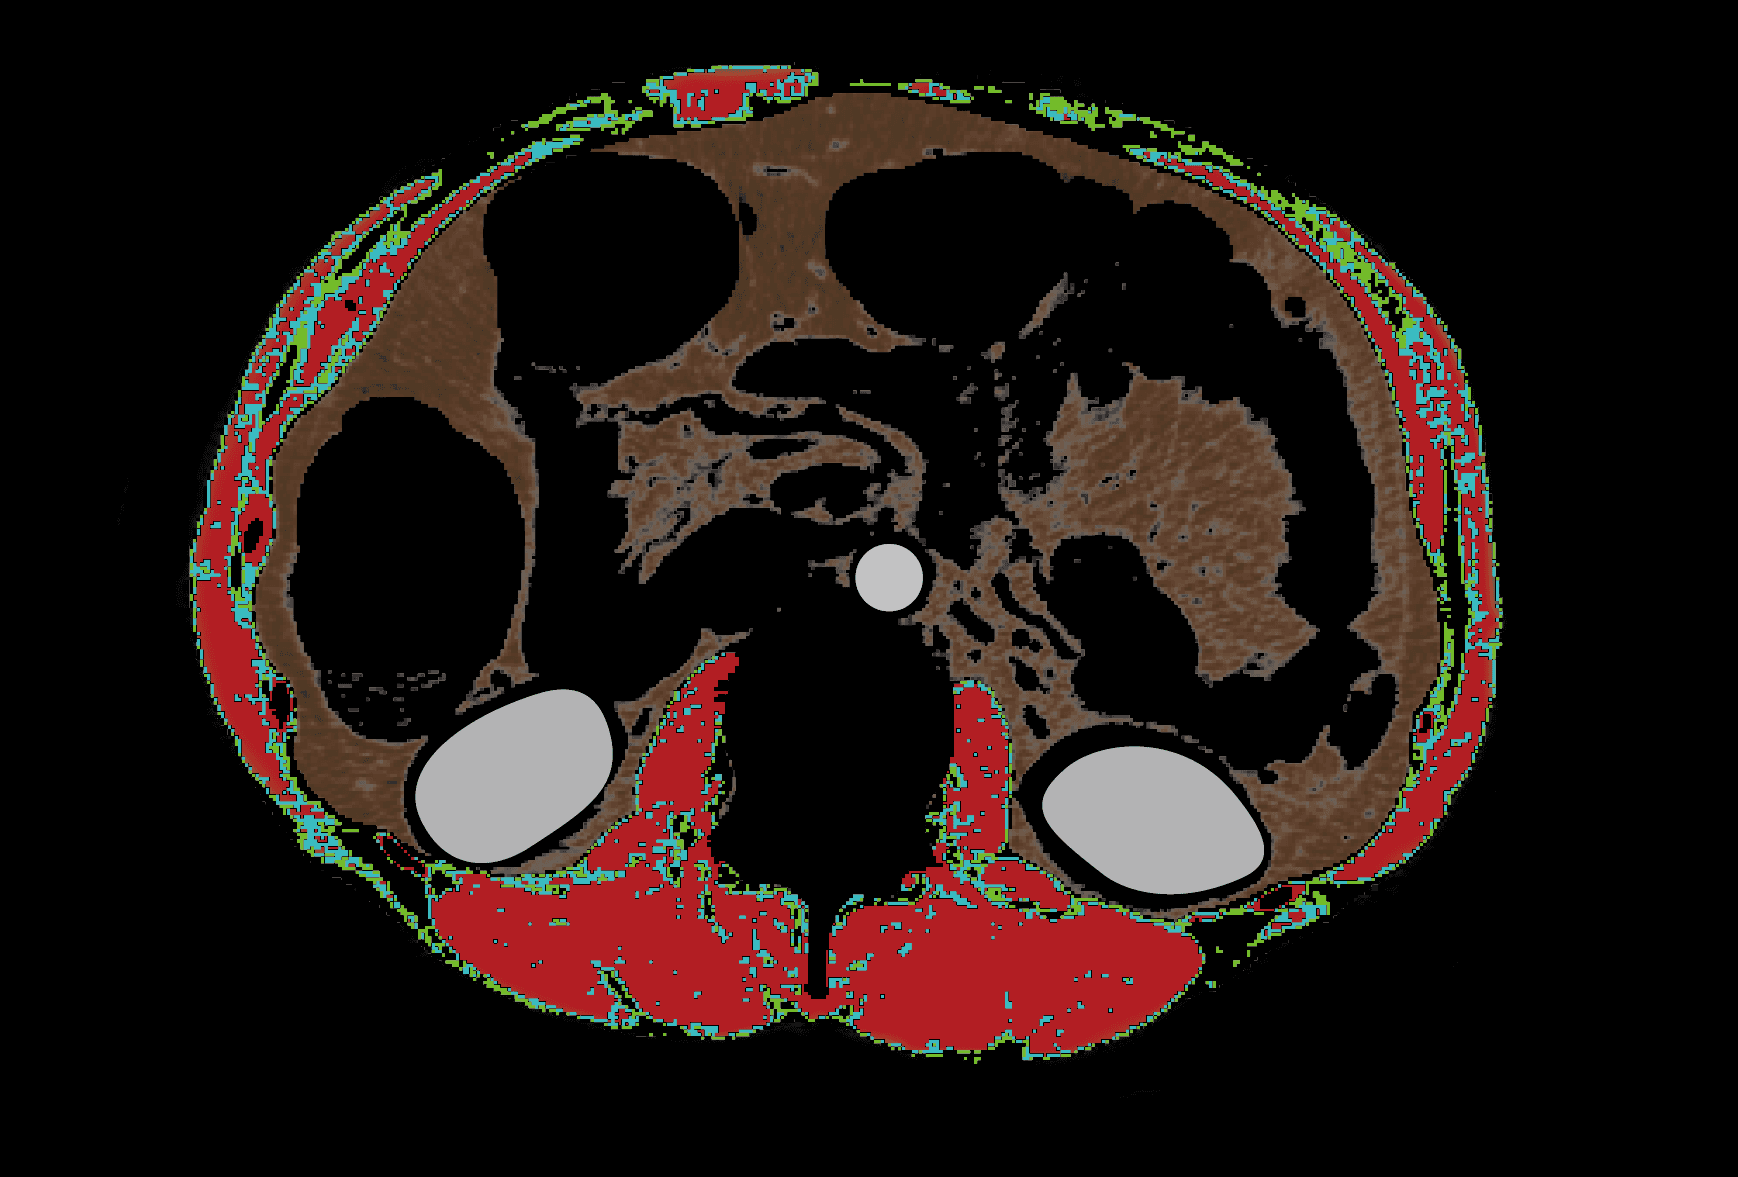
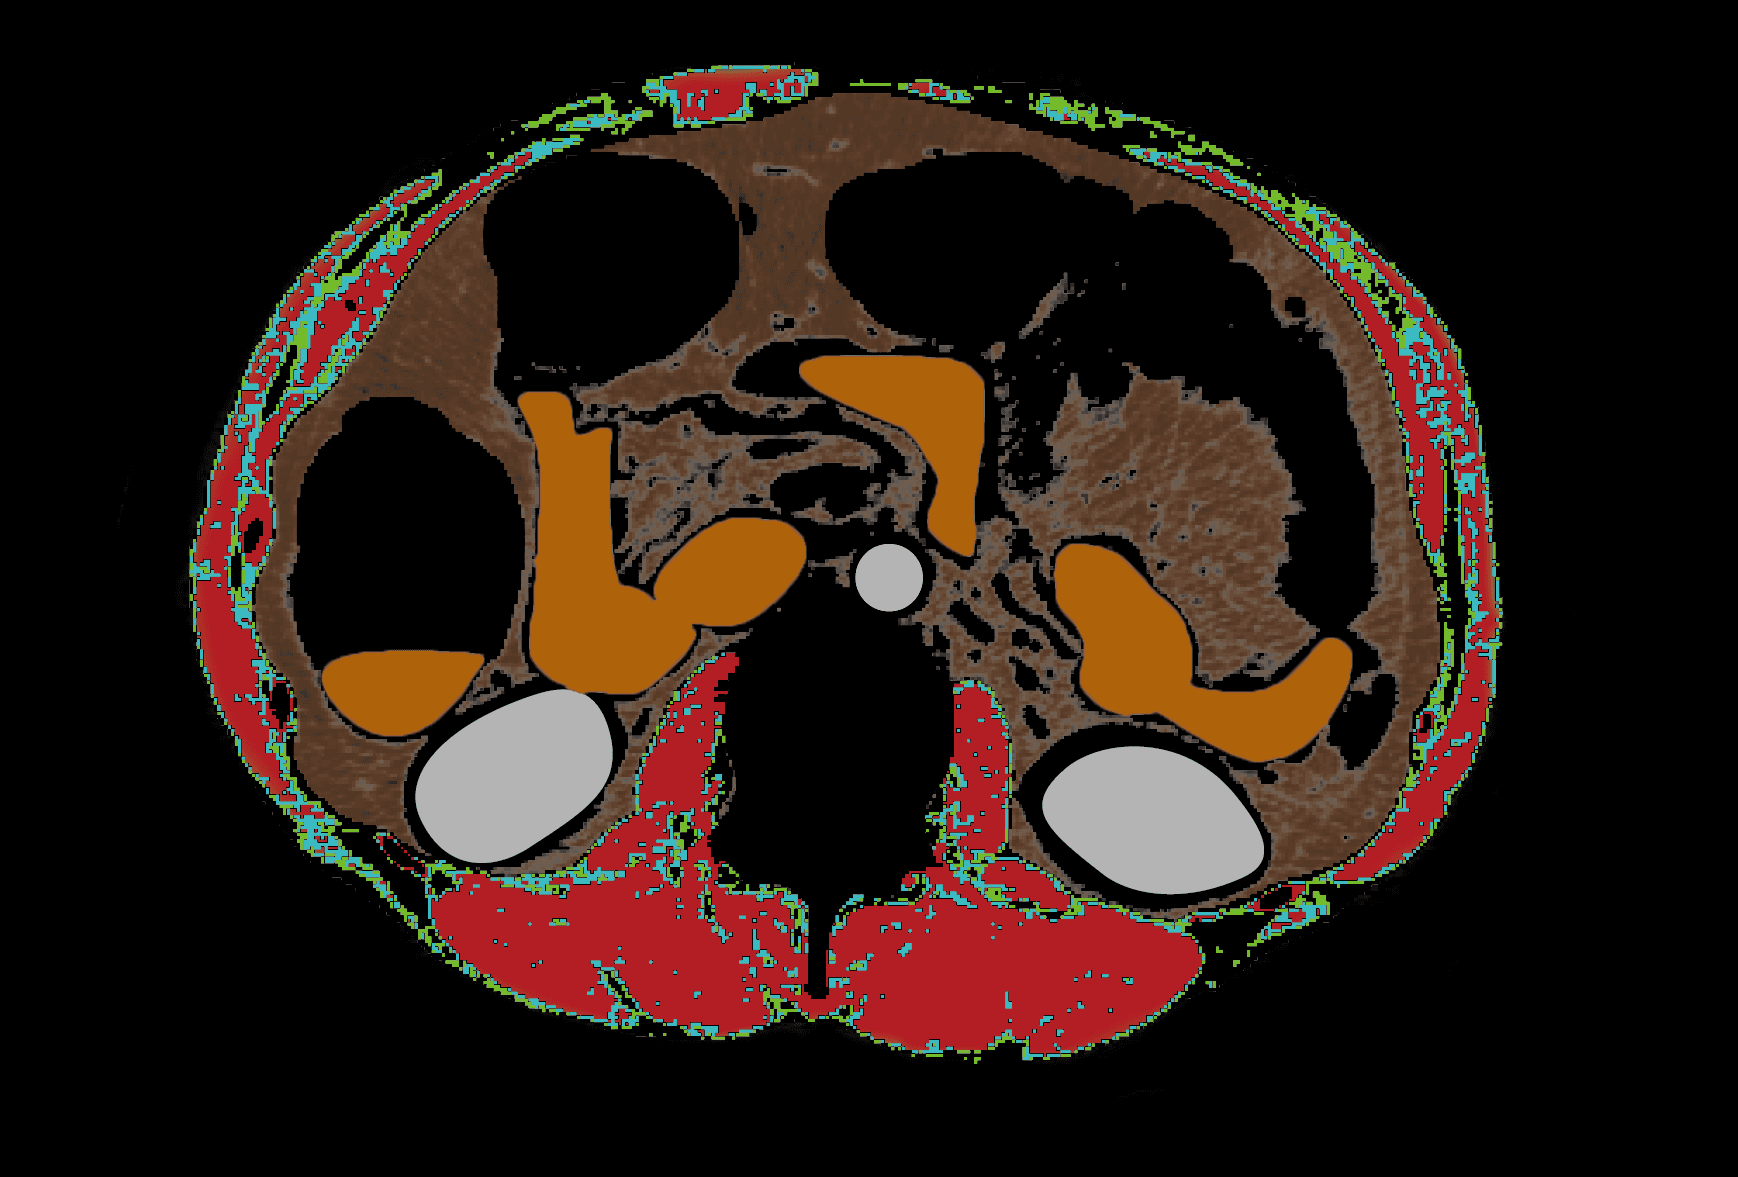
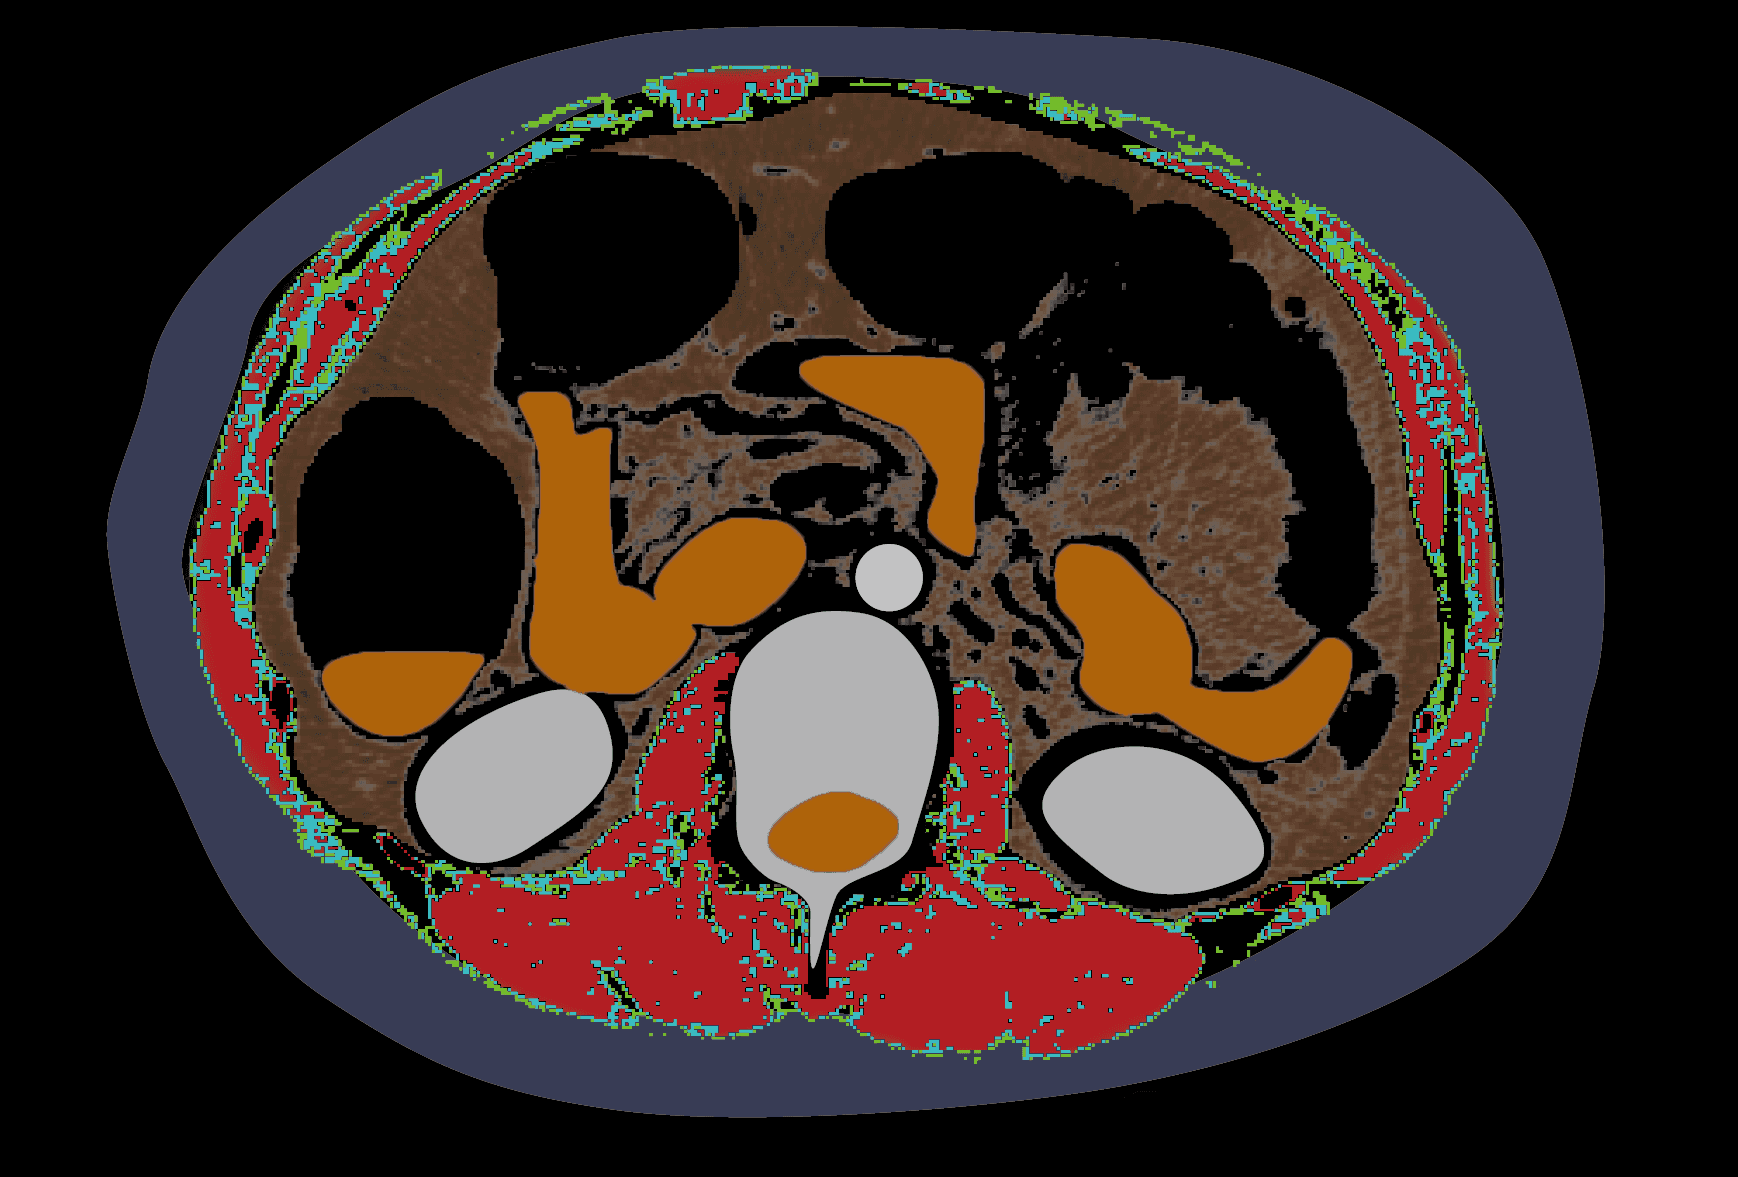
Segmentation and measurement of muscle/fat area
AI precisely segments muscle and fat based on quality and provides quantified data. |


Intuitive and accessible analysis is provided through various structured reports and patient-focused explanatory materials. |


96% Muscle/fat
segmentation alignment
Model performance was validated using 21,708 abdominal CT scans, showing a high level of concordance.
Explore the association between metabolic diseases and
index.

Type 2 diabetes mellitus
Higher VFA and VSR at baseline were independent risk factors for the development of T2DM.
NAFLD
(Non-alcoholic fatty liver disease)
A higher proportion of good quality muscle was associated with lower risks of NAFLD and fibrosis. |


Sarcopenia
BMI-adjusted index(SMA/BMI) was the best index of CT-measured SMA to reflects the age-related muscle changes and to maximize the diagnostic yield for sarcopenia.
Myosteatosis
The NAMA/TAMA index developed in this study was useful for assessing myosteatosis

Have questions?Check out our FAQ for more information. |
What is Myo Signal?
Can a single L3 slice accurately represent overall muscle and fat distribution?
How is Myo Signal different from conventional body composition analyzers?
What does the NAMA/TAMA Index graph represent?