Jan 23, 2026
ECR
Abstract
MYO
Opportunistic Osteoporosis Screening on Chest CT Using Vertebral Normal-Density Voxel Distribution: A Voxel Density Graph–Derived Bone Mineral Content Proxy
Jemyoung Lee1 , Woo Young Kang2
1 Promedius Inc., Seoul, Republic of Korea
² Department of Radiology, Guro Hospital, Korea University Medical Center, Seoul, Republic of Korea
Purpose
To evaluate a voxel density graph (VDG) that constructs graph representation of the vertebral-wide distribution and connectivity of normal-density voxels to derive a bone mineral content proxy (BMCP) for opportunistic osteoporosis screening.
Methods
This single-center retrospective study included 301 patients (50.8±6.9 years) from a tertiary hospital with non-contrast chest CT and lumbar spine DXA within 12 months; cases with prior spinal surgery, vertebral fracture, or osteolytic lesions were excluded. Vertebral bodies
were segmented and normal density voxels (≥160 HU) within the vertebral body were selected as nodes. Starting from the vertebral centroid, edges were iteratively added to link each node to at least one neighboring node within a 10-pixel radius; the radius was empirically selected. BMCP was defined as average graph density 2E/N (E; edges, N; nodes) and computed on the L1 mid-vertebral slice ±1. For comparison, a conventional ROI-based volumetric BMD measure was obtained as the median HU from an elliptical L1 trabecular ROI centered at the centroid while excluding basivertebral vein. Osteoporosis was defined as lumbar spine DXA T-score ≤ −2.5. ROC analysis compared AUCs between the ROI-based measure and BMCP.
Results
Osteoporosis was present in 38/301 patients (12.6%). BMCP discriminated osteoporosis with an AUC of 0.83 (95% CI, 0.75–0.91), outperforming the ROI-based approach (AUC 0.76; 95% CI, 0.67–0.85). VDGs demonstrated distinct vertebral-wide voxel-organization patterns between osteoporotic and non-osteoporotic subjects, providing interpretable information beyond summary HU.
Conclusion
BMCP improved CT-based osteoporosis detection compared with focal ROI metrics and may better approximate DXA-referenced assessment for opportunistic screening on chest CT.
Limitations
Normal density HU threshold can vary across CT protocols. Also, BMCP was derived from three L1 slices rather than full vertebral volumes; full-volume/multi-level extension, resampling-based uncertainty estimates, and external/prospective validation are warranted.
Figure 1. Workflow for voxel density graph (VDG)–based bone mineral content proxy (BMCP) computation. Vertebral bodies were automatically segmented from chest CT using segmentation AI model (TotalSegmentator), and normal-density voxels were selected using an attenuation threshold of ≥160 HU (Pickhardt et al., 2013). The selected voxels were represented as nodes and organized into a voxel density graph based on spatial connectivity. BMCP was defined as the average graph density (2E/N; E = number of edges, N = number of nodes). Representative cases illustrate the normal-density voxel distributions, corresponding VDGs, and resulting BMCP values.
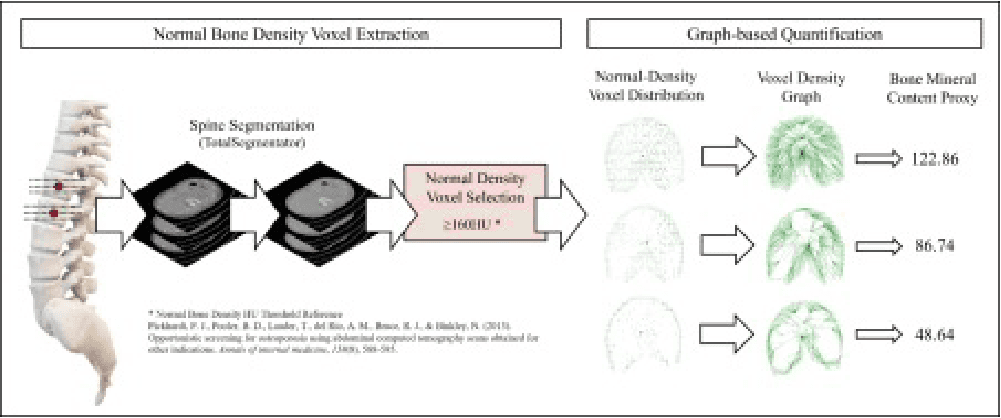
Figure 2. Representative examples of VDG–based BMCP across DXA categories. Cases are grouped by lumbar spine DXA T-score as normal (T-score ≥ −1.0), osteopenia (−1.0 > T-score > −2.5), and osteoporosis (T-score ≤ −2.5). For each subject, an axial CT slice at the L1 level
is shown with the segmented vertebral body mask and selected normal-density voxels (≥160 HU), followed by the resulting normal-density voxel distribution, the corresponding VDG, and the computed BMCP value. Lower BMCP values were observed in osteoporosis compared with normal/osteopenia in these examples.
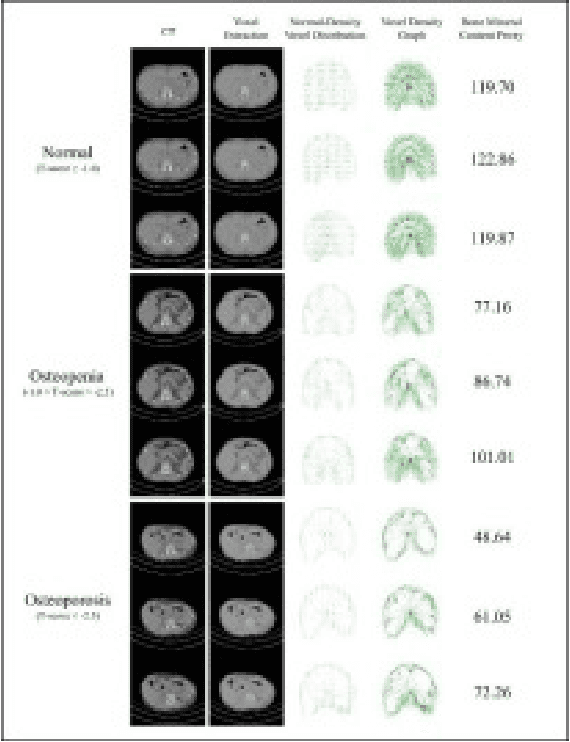
Figure 3. Receiver operating characteristic (ROC) curves comparing the proposed VDG–based BMCP with a conventional ROI-based volumetric BMD (vBMD). ROC
curves were generated by varying the decision threshold for each metric, with lumbar spine DXA T-score ≤ −2.5 used as the reference standard. The VDG-based BMCP achieved a higher discriminative performance (AUC = 0.83) than the ROI-based vBMD approach (AUC = 0.76). Markers indic
ate the optimal operating points selected by the Youden index for each method.
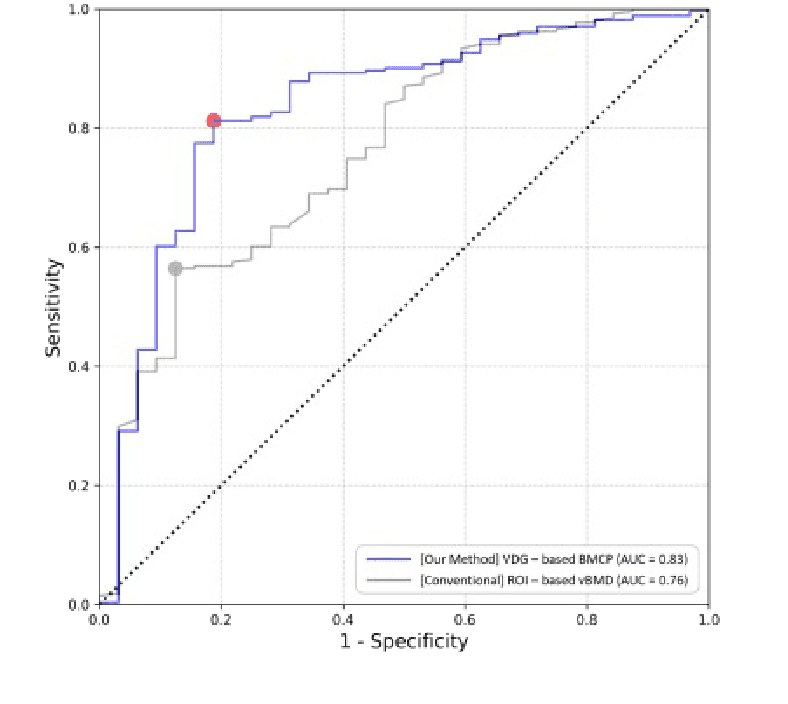
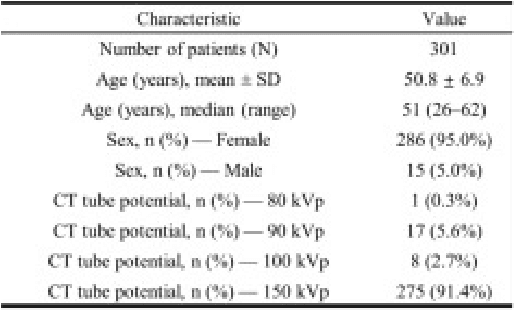
Table 1. Patient chara
cteristics and CT acquisition parameters. Summary demographics (age and sex) and CT tube potential distribution are reported for the study cohort (N = 301). Age is presented as mean ± standard deviation and as median (range), and sex and tube potential are presented as n (%).